Applying Slow Feature Analysis to Image Sequences Yields a Rich Repertoire of Complex Cell Properties - Additional Material
In the paper
Berkes, P. and Wiskott, L. (2002).
Applying Slow Feature Analysis to Image Sequences Yields a Rich
Repertoire of Complex Cell Properties.,
in Artificial Neural Networks - ICANN 2002,
ed. José R. Dorronsoro, Springer Verlag, pp. 81-86
(bibtex,
abstract,
.ps)
we extracted slow varying signals out of input image sequences. In order to characterize the learned units, we computed the optimal excitatory and inhibitory stimuli (S+ resp. S-) and the invariances, i.e. those variations of S+ to which the unit is most insensitive.

The above image gives an overview of the optimal stimuli for the first (the slowest) 48 units resulting from one typical simulation. Most S+ (left patch) look like Gabor wavelets (in agreement with physiological data), i.e. the units respond best to oriented edges. Since inhibition plays an important role in our model, S- (right patch) is usually structured and is similar to a Gabor wavelet. All the units shown in the image but the first two have been classified as complex cells from their response characteristics.
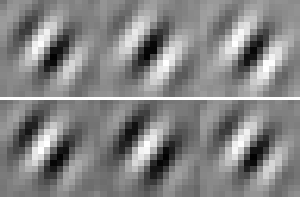
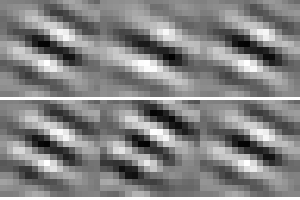
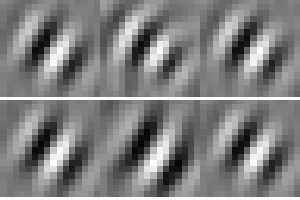
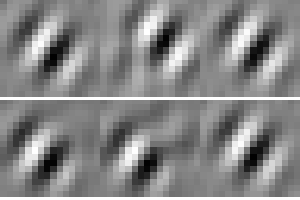
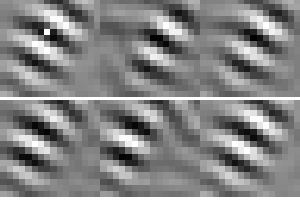
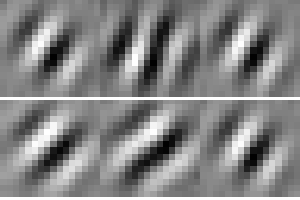
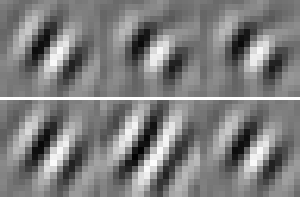
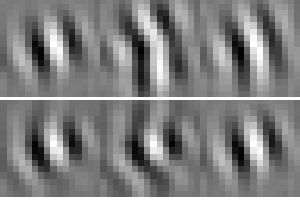
The following animations show two examples units for each of the main classes of invariances found in our simulations. For each invariance we modify S+ until the response of the considered component drops under 80% of its maximal output. Each frame shown is thus a stimulus which elicits a response near to the optimum one.
For further informations please refer to the cited paper or mail to

If your browser fails to show looping animations, please reload the page or open the images one by one (e.g. in "Netscape" right-click and select "View Image")
Phase shift invariance
|
Frequency change invariance
|
||||
Position change invariance
|
Orientation change invariance
|
||||
Size change invariance
|
Curvature invariance
|
